In today’s data-driven world, geospatial data plays a critical role in shaping decisions, guiding development, and responding to changes across diverse fields. But what exactly makes data geospatial? In simple terms, geospatial data refers to information that has a geographic or spatial aspect to it, meaning it is data tied to specific locations on the Earth’s surface. This data can be as simple as the coordinates of a place or as complex as multi-layered information that connects environmental, demographic, and infrastructural details to a particular area.
From Google Maps to climate monitoring systems, geospatial data surrounds us in our everyday lives, offering unique insights and applications.

What Is Geospatial Data?
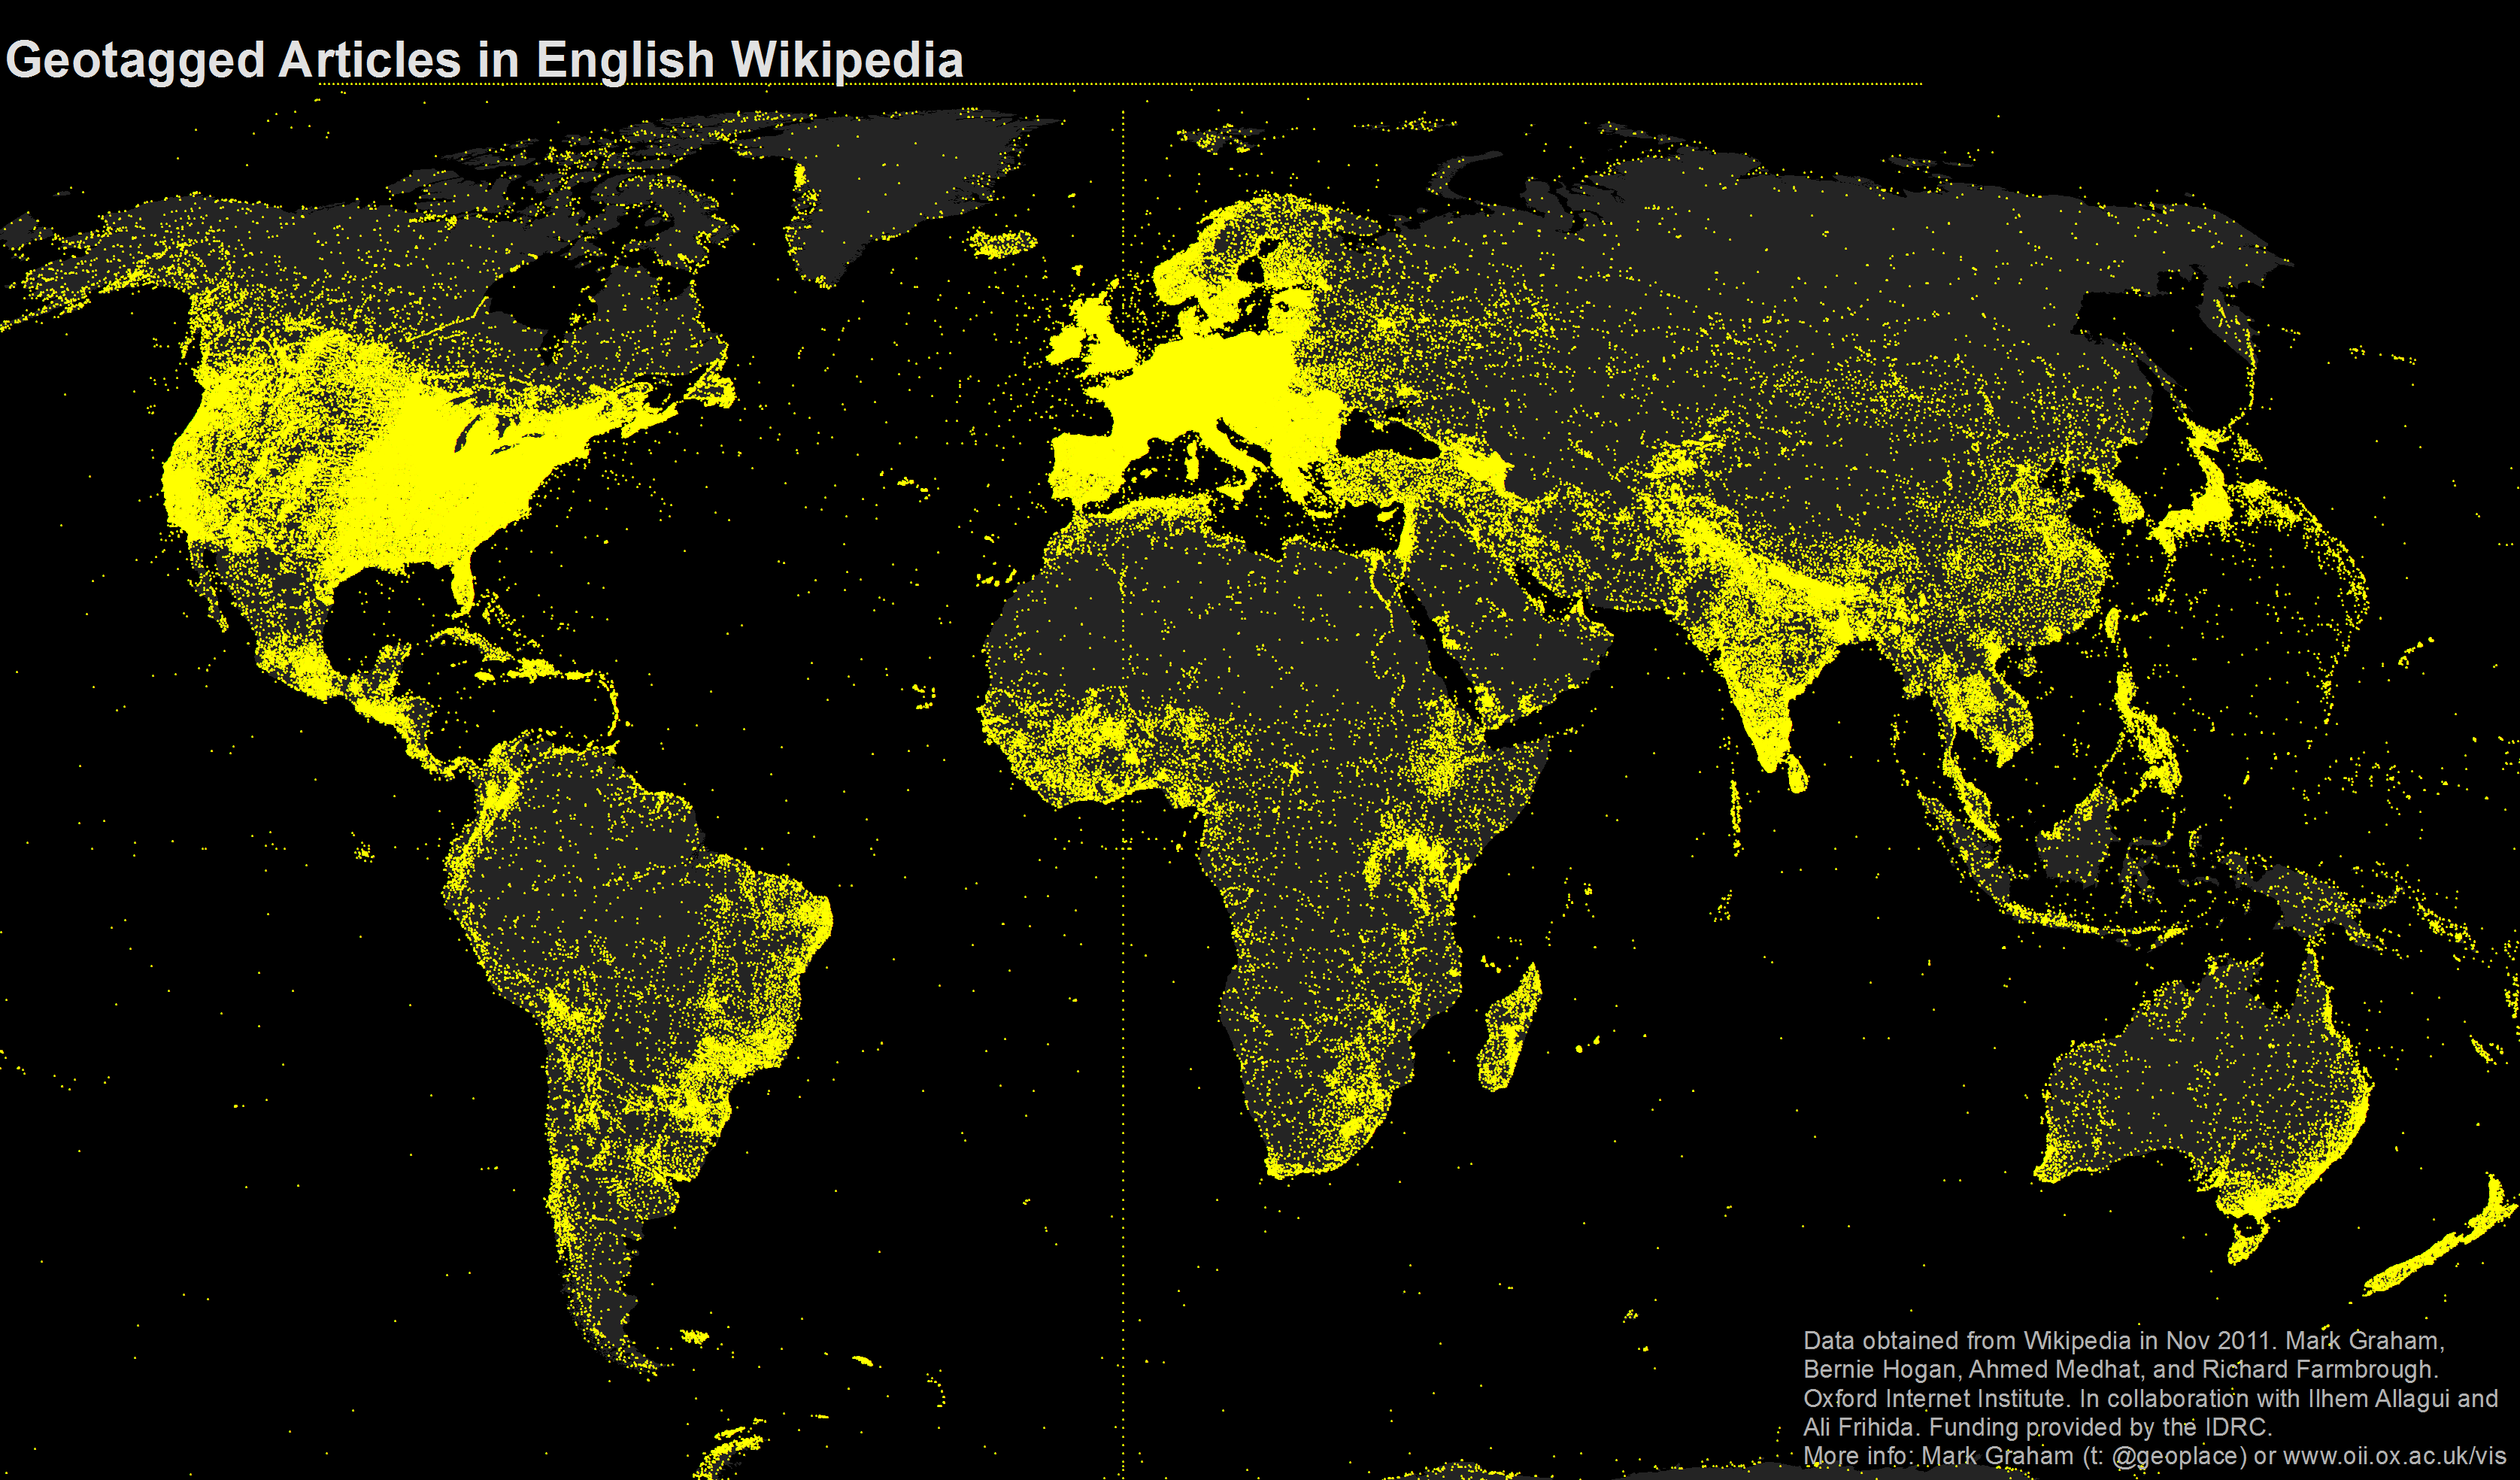
Geospatial data is data that is associated with specific locations. It includes any type of data that is tied to coordinates on Earth, such as latitude and longitude. This geographic connection makes geospatial data highly valuable for mapping, analysis, and spatial understanding, as it allows us to visualize data in relation to physical locations.
Examples of Geospatial Data in Everyday Life:
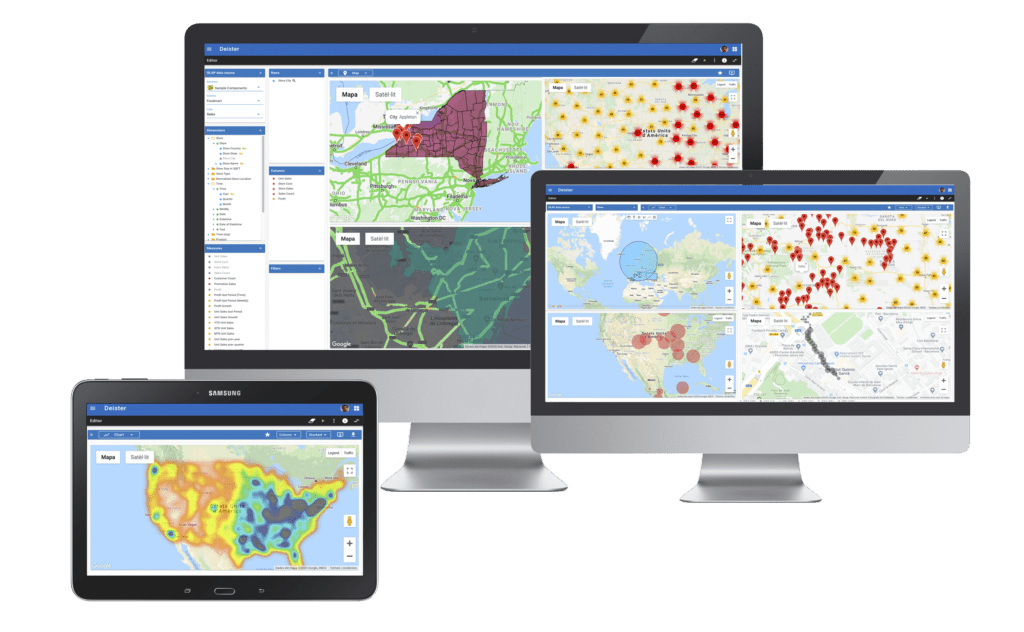
- Maps: Whether you’re using a paper map or a digital one, geospatial data helps represent real-world locations accurately. Geographic Information Systems (GIS) take this further by layering additional data—like transportation routes, population density, and even real-time traffic information—on top of these maps.
- GPS Tracking: GPS technology, which relies on satellite data, is a common example of geospatial data. From navigation apps to location-based services like food delivery, GPS uses geospatial data to pinpoint and track specific positions.
- Weather Forecasting: Weather stations and satellites collect geospatial data to create forecasts based on the precise locations of storms, temperature zones, and weather patterns.
Key Characteristics of Geospatial Data
Geospatial data can be broken down into a few essential characteristics:
- Spatial Attributes: These are coordinates or attributes that specify a location’s position on Earth. Spatial attributes might include elements like latitude, longitude, and elevation, providing the where aspect of geospatial data.
- Non-Spatial Attributes: These include additional information tied to a location, such as the population of a city, temperature data, or types of vegetation in a specific region. Non-spatial attributes give context to geospatial data, transforming it from simple coordinates into a more meaningful dataset.
- Time-Based Element: Many geospatial datasets are time-sensitive, providing insights into changes over time. This is particularly valuable in fields like environmental monitoring and urban development, where it’s essential to track changes in a specific location over a period.
Geospatial Data vs. Regular Data: What’s the Difference?
What makes data geospatial, as opposed to any other type of data? The defining difference lies in its connection to specific physical locations. Regular data can be purely abstract or unrelated to any particular place, such as a list of book titles or customer feedback. Geospatial data, however, is always tied to spatial attributes.
For instance:
- Regular Data: Sales figures, customer demographics, or product ratings—none of these data points require a specific location to be understood or used.
- Geospatial Data: On the other hand, data about store sales in different regions or locations with higher demand for a particular product becomes geospatial data. This data not only tells us what is happening but also where it’s happening.
This geographic component is what gives geospatial data unique value, making it critical in mapping, environmental research, and urban planning.

The Basics of Geospatial Information Systems (GIS)
What is GIS, and Why is it Important?
A Geographic Information System (GIS) is a framework that allows us to capture, store, manipulate, analyze, and display geospatial data. GIS technology is the backbone of many mapping and spatial analysis applications, enabling us to visualize and understand spatial relationships within datasets. But GIS is not just a map—it’s a powerful analytical tool that helps users interpret complex spatial data and make informed decisions based on the “where” component of that data.
GIS systems are essential across various industries. Urban planners, for example, rely on GIS to assess land use, population density, and infrastructure placement. In environmental science, GIS aids in monitoring deforestation, climate changes, and natural disasters. Transportation and logistics companies use GIS to optimize delivery routes and improve supply chain efficiency. By layering different types of data on a single map, GIS systems create a multidimensional view of information, revealing patterns and relationships that would otherwise go unnoticed.
Key Applications of GIS Across Industries:
- Urban Planning: Analyzes spatial patterns to optimize land use, assess housing needs, and improve public transportation.
- Agriculture: Enables precision farming by monitoring soil conditions, crop health, and weather patterns.
- Environment and Conservation: Tracks biodiversity, studies climate changes, and supports conservation efforts by mapping ecosystems.
- Logistics and Transportation: Improves route planning and asset tracking by mapping real-time data for vehicle locations and road conditions.
How GIS Works with Geospatial Data
At its core, a GIS uses a combination of spatial and non-spatial data to analyze and visualize geospatial information. Here’s a simplified breakdown of how GIS processes work:
- Data Collection: Geospatial data can be collected from numerous sources, including satellites, GPS devices, drones, sensors, and surveys. This raw data may contain both spatial attributes (such as coordinates) and non-spatial information (such as the type of land cover or population density).
- Data Processing: Once data is collected, it’s processed and cleaned to ensure accuracy and consistency. Data may be converted into layers, with each layer representing a different dataset, such as roads, water bodies, or population zones. This layering allows GIS users to analyze the spatial relationships between different types of data.
- Analysis and Modeling: GIS offers various analytical tools, such as buffering (which creates zones around specific points) and spatial interpolation (estimating values at unknown points based on surrounding data). These tools allow users to study patterns, predict outcomes, and model hypothetical scenarios.
- Visualization: GIS software converts processed data into visual formats, often as maps or 3D models. Visualizing data on a map makes it easier to identify trends, anomalies, and spatial relationships, making GIS an invaluable tool for decision-making.
Common GIS Tools and Software
A variety of GIS software platforms are available to help users work with geospatial data, ranging from basic tools for beginners to advanced applications for professionals. Here are some popular options:
- ArcGIS: One of the most widely used GIS platforms, ArcGIS offers powerful tools for data analysis, mapping, and spatial visualization. It’s commonly used in government, research, and private sectors.
- QGIS (Quantum GIS): A popular open-source alternative to ArcGIS, QGIS provides a broad range of features for spatial analysis and mapping. It’s particularly favored by smaller organizations and individuals due to its accessibility and active community support.
- Google Earth Engine: Known for its satellite imagery and remote sensing capabilities, Google Earth Engine is a cloud-based platform suited for environmental and climate research.
- Mapbox: Focused on providing interactive and customizable maps, Mapbox is a GIS tool used widely in web and mobile applications, such as ride-sharing apps and social media platforms.
Each of these tools has its strengths, from robust mapping and analysis capabilities in ArcGIS to customizable, interactive maps in Mapbox. GIS tools transform complex datasets into visual insights, making it easier to understand spatial patterns and make data-driven decisions in various fields.

Sources and Types of Geospatial Data
Where Does Geospatial Data Come From?
Geospatial data is collected from a variety of sources, each bringing unique advantages and applications. These sources allow organizations, governments, and researchers to gather highly accurate information about the Earth’s surface and its features. The most common sources of geospatial data include:
- Satellites: Satellites orbiting the Earth continuously capture images and gather data, providing valuable information about weather patterns, land use, natural disasters, and environmental changes. Satellite data is crucial for large-scale mapping and remote sensing, making it indispensable in fields like environmental science and climate research.
- GPS Systems: Global Positioning System (GPS) devices collect geospatial data by pinpointing precise locations on Earth. These devices are used extensively in navigation, mapping, and location-based services, such as tracking shipments or providing real-time directions.
- Drones: Drones, or UAVs (unmanned aerial vehicles), are equipped with cameras and sensors that capture detailed geospatial data from specific areas. They are particularly useful in sectors like agriculture, construction, and emergency response, as they can quickly gather high-resolution data over a focused area.
- Sensors: Ground-based sensors monitor environmental conditions like temperature, humidity, and pollution levels. This data is often combined with spatial information to create geospatial datasets that can track climate trends, air quality, and other environmental factors.
- Surveys and Censuses: Surveys and census data contribute demographic, economic, and social information that can be associated with specific locations. For instance, census data about population density or income levels can be mapped to understand patterns across cities or countries.
Types of Geospatial Data
Geospatial data is categorized into different types, each serving a unique purpose and offering specific insights when analyzed. These types are primarily divided into vector, raster, and tabular data, each format serving different uses within a GIS system.
- Vector Data:
- Points: Represent individual locations, such as cities on a map or the location of specific assets like fire hydrants or electric poles.
- Lines: Used to represent linear features, such as roads, rivers, and pathways.
- Polygons: Depict area-based features, such as lakes, city boundaries, or property parcels.
Applications of Vector Data: Vector data is highly versatile, supporting applications that require precise boundaries and lines, like mapping transportation networks or analyzing property boundaries.
- Raster Data:
- Raster data consists of grids of cells or pixels, each with a value representing information at that location, such as elevation, temperature, or land cover type.
- Satellite images and aerial photographs are common forms of raster data, offering a continuous surface view of the Earth that is invaluable for large-scale analyses.
Applications of Raster Data: Raster data is often used for environmental monitoring (such as tracking deforestation or water levels) and land use planning, as it allows for the analysis of large, continuous spaces.
- Tabular Data:
- Tabular data refers to data tables that include location-based attributes but don’t inherently display spatial properties until linked with GIS. For example, a table of earthquake records might include the date, time, and magnitude alongside each event’s latitude and longitude.
Applications of Tabular Data: This data becomes powerful in GIS when associated with geographic information, supporting analyses in public health (like mapping disease outbreaks), retail (analyzing store locations), and more.
Examples of Geospatial Data Applications
To see these types of data in action, let’s look at some applications that rely on the integration of vector, raster, and tabular data:
- Mapping: GIS maps rely on vector data to display locations, roads, and boundaries accurately, while raster data might overlay information like topography or climate zones to enrich the visual presentation.
- Environmental Monitoring: By combining satellite raster images of forest cover with tabular data on land use policies, researchers can assess the impact of conservation efforts on deforestation.
- Disaster Response: In the aftermath of natural disasters like earthquakes or hurricanes, drones collect raster data to map damaged areas, while GPS tracking systems (using vector points) monitor the location of rescue teams and resources.
These applications highlight how different types of geospatial data serve various analytical purposes, allowing decision-makers to address challenges that span from logistics to environmental conservation.

Components of Geospatial Data
Spatial Data: What, Where, and How
Spatial data forms the foundation of geospatial information, providing the where aspect essential to understanding geographic relationships. This component of geospatial data includes coordinates (latitude and longitude), projections, and geographic positioning, which together create a precise reference system for locating places, objects, or events on Earth.
Key Elements of Spatial Data:
- Coordinates: The most basic component, with latitude and longitude coordinates defining a point’s exact position. Latitude measures north-south positioning, while longitude measures east-west. Together, these coordinates pinpoint any location on the planet.
- Projections: Maps are flat representations of a round Earth, requiring projections to translate curved surfaces into two-dimensional forms. Different projections (e.g., Mercator, Lambert Conformal Conic) serve different purposes, balancing factors like area accuracy, distance, and direction.
- Geographic Positioning Systems (GPS): GPS technology uses satellite data to provide real-time, highly accurate location information, essential in navigation, mapping, and spatial analysis.
In practice, spatial data answers questions about location, such as Where is the closest hospital? or What is the distance between two locations? Spatial data also enables proximity analysis, such as identifying how close residential areas are to water bodies or protected natural zones.
Attribute Data: Understanding the ‘What’ in Geospatial Information
Attribute data, also known as descriptive data, is the non-spatial component that adds depth to geospatial data. It provides context by describing the characteristics of spatial data, turning geographic coordinates into rich, informative datasets. For instance, while spatial data may locate a school, attribute data describes it by including details like enrollment numbers, building condition, or type of school.
Examples of Attribute Data:
- Demographic Information: Population density, age distribution, or income levels in a specific area.
- Environmental Characteristics: Soil type, vegetation cover, or air quality of a given region.
- Infrastructure Details: Information on roads (e.g., speed limits, number of lanes), utilities, and transportation networks.
Attribute data enhances geospatial information by answering questions such as What are the characteristics of this location? or What is the level of air pollution in this city? When combined with spatial data, attribute data allows users to create detailed analyses, make predictions, and plan interventions.
For example, city planners may analyze both spatial and attribute data to assess which areas of a city have the highest population density and are most in need of additional public transport routes.
Metadata: The Essential Information about Geospatial Data
Metadata, often called “data about data,” is a vital part of geospatial information that ensures data accuracy, usability, and integrity. Metadata provides descriptive details about how, when, and by whom data was collected, as well as its format, accuracy, and intended use. Proper metadata makes it easier to understand and use geospatial data effectively, allowing users to evaluate data quality and applicability.
Key Components of Metadata:
- Source: Information about where the data originated, whether from a satellite, survey, or other sources.
- Accuracy: Describes the precision of data, which is particularly important in geospatial applications that require high levels of detail (e.g., engineering or construction projects).
- Date: Indicates when the data was collected, allowing users to determine its relevance and currency.
- Resolution: For raster data, resolution specifies the size of each pixel, affecting the level of detail and accuracy.
Metadata is critical for data sharing, as it ensures that others who use the data can understand its origins, limitations, and ideal applications. Without metadata, data analysts may lack crucial information needed to interpret datasets correctly, potentially leading to misinformed decisions.
Example of Metadata Usage: Suppose a team of researchers is studying deforestation patterns using satellite imagery. Metadata provides them with essential details like the date of each satellite image, the accuracy of the spatial resolution, and any processing steps applied. This information allows researchers to determine the reliability of the images and compare deforestation over time accurately.
By combining spatial data, attribute data, and metadata, geospatial datasets become rich sources of information that empower users to understand not only where things are happening but also what is happening, how accurate the data is, and how it should be used. Each component adds a layer of detail, making geospatial data a powerful tool for in-depth analysis and decision-making.